Hey Guys,
I am starting this challenge really late but I thought I would still give it a try. 
So I decided to work with the theme Finance and create Bitcoin price tracker that will show the historical price of bitcoin on a graph.
I will be creating the UI using UIKit (Still need to learn SwitfUI  ) and I found a nice little API that I can use to pull the historical data from, its call nomics.
So stay tuned as I get started
1 Like
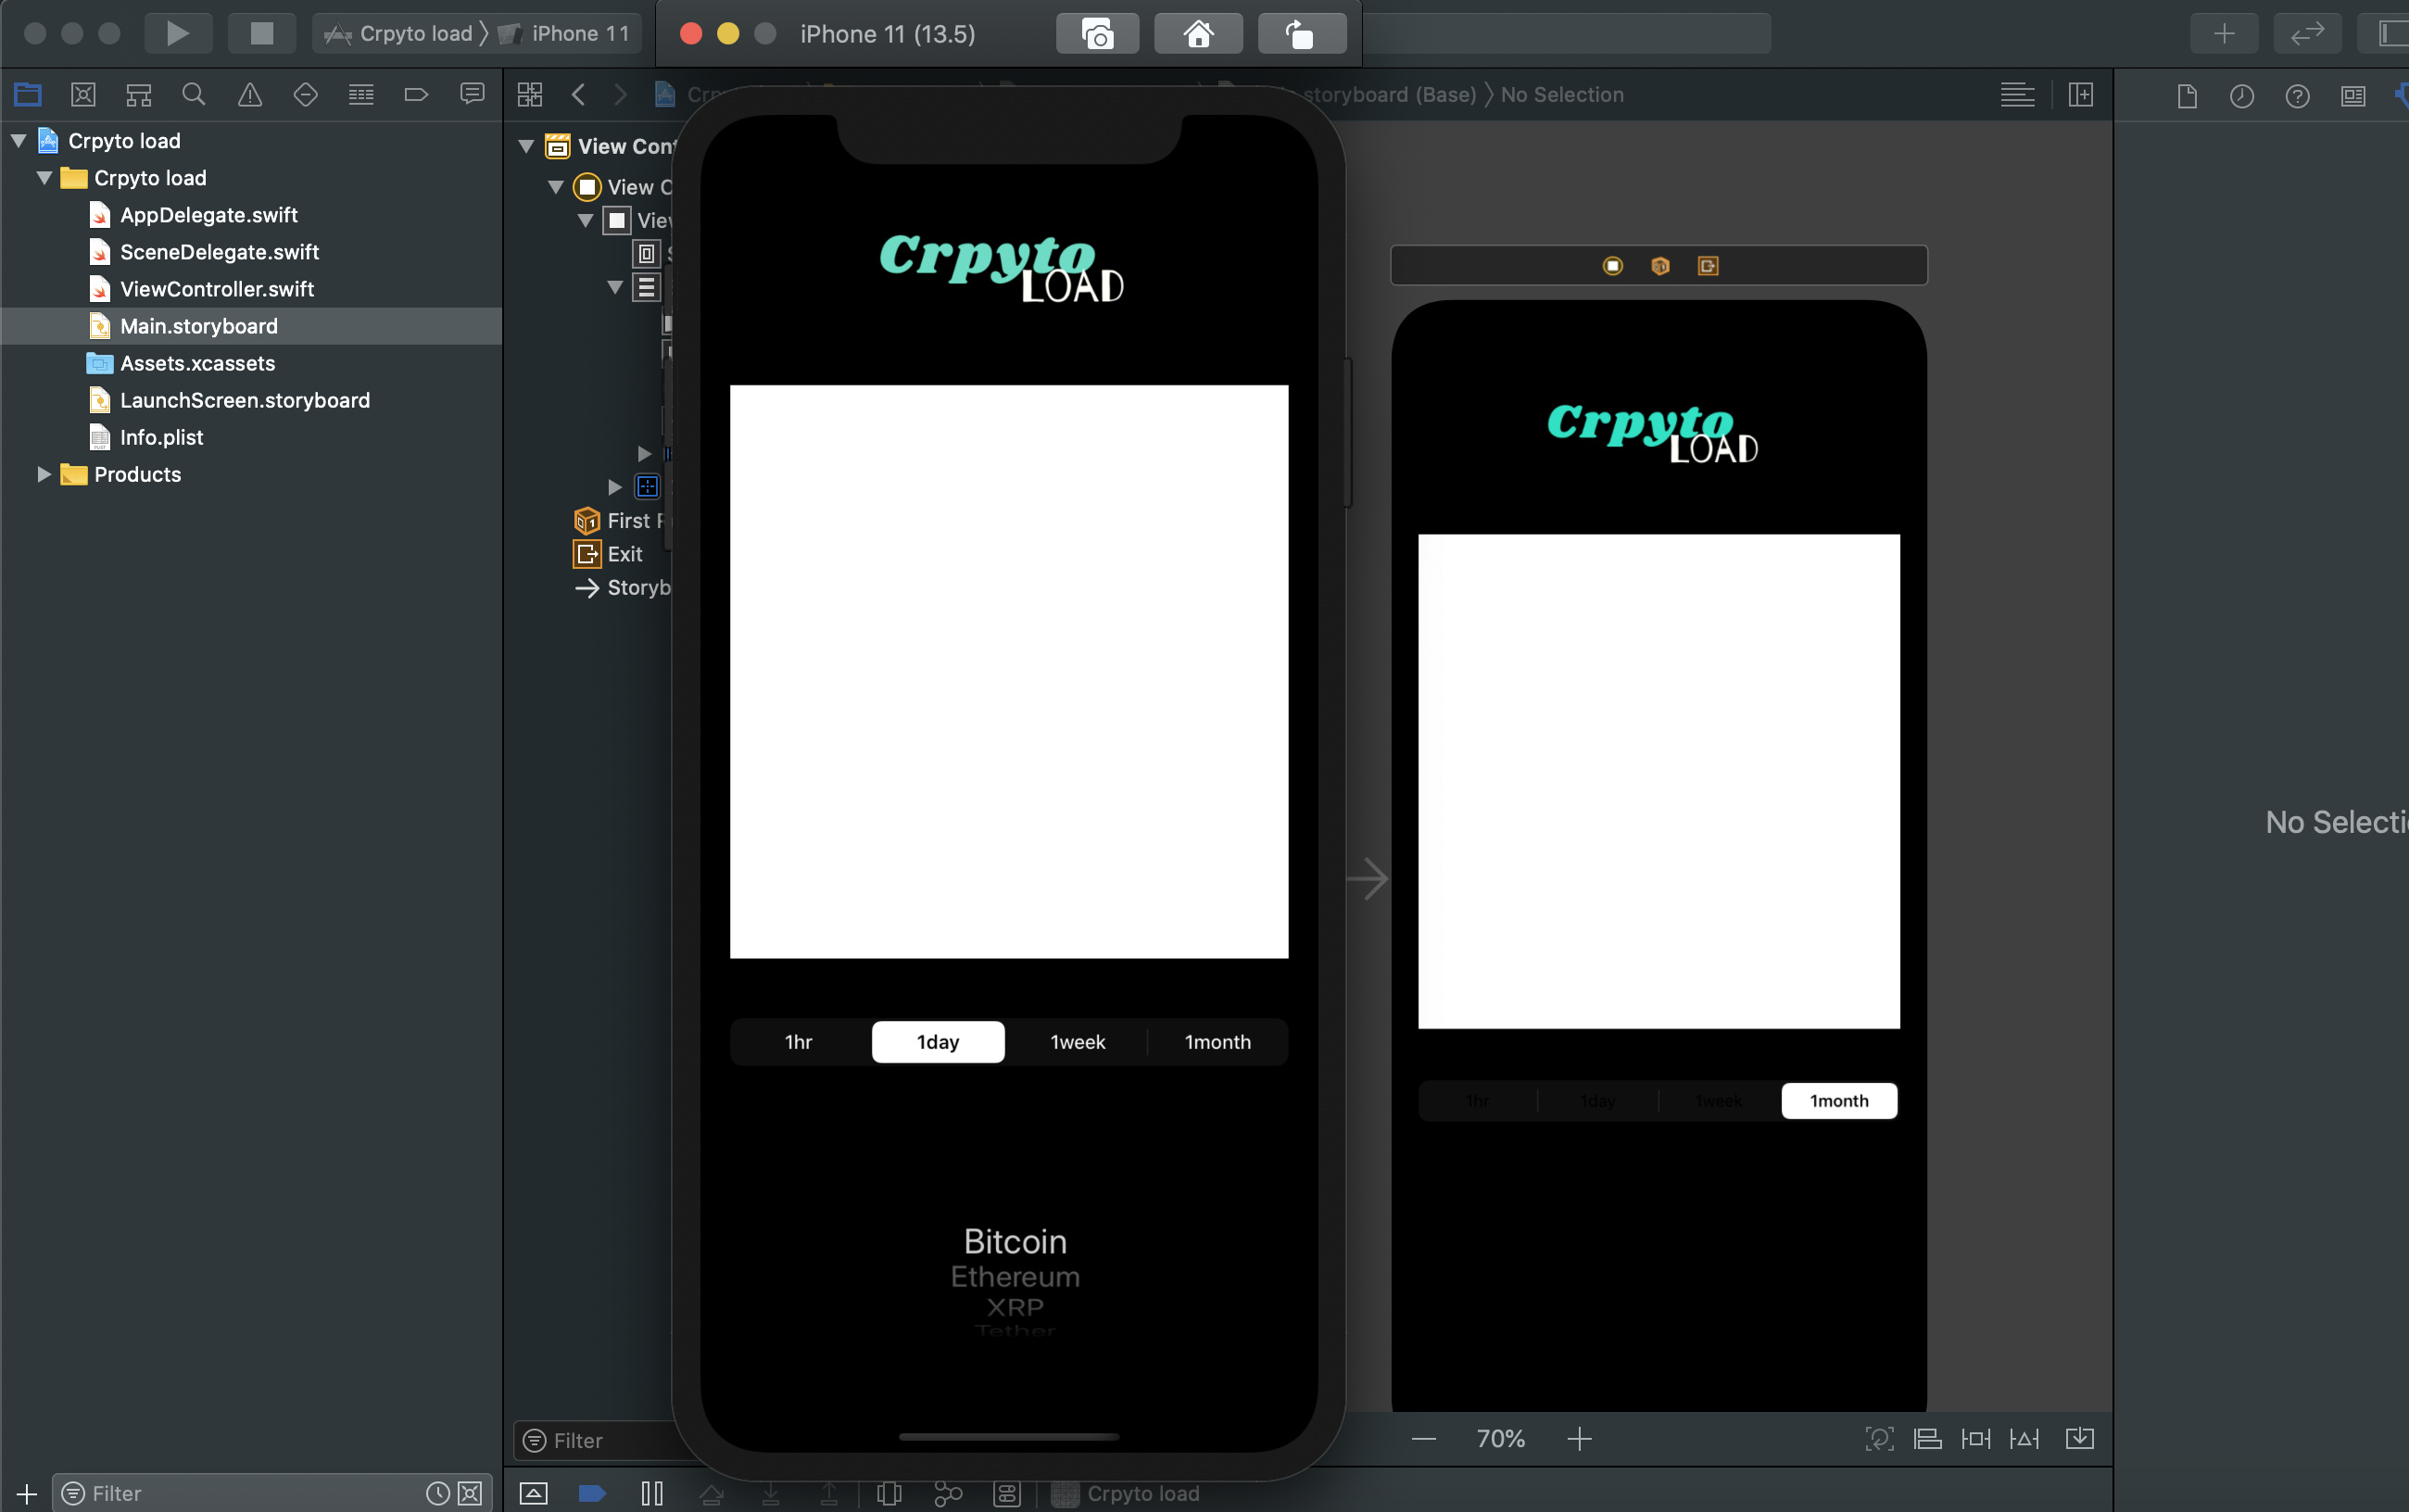
Ok, So far I created the basic interface and worked out the overall logic of the app. Added a UISegment that will be used to adjust the historical data timeframe in the graph. and a picker view that will select the cryptocurrency.
So next I work set up a line chart to display the cryptocurrency data, after that I will work on pulling the data from the API.
Here is a sample of the work so far
Let me know that you guys think so far.
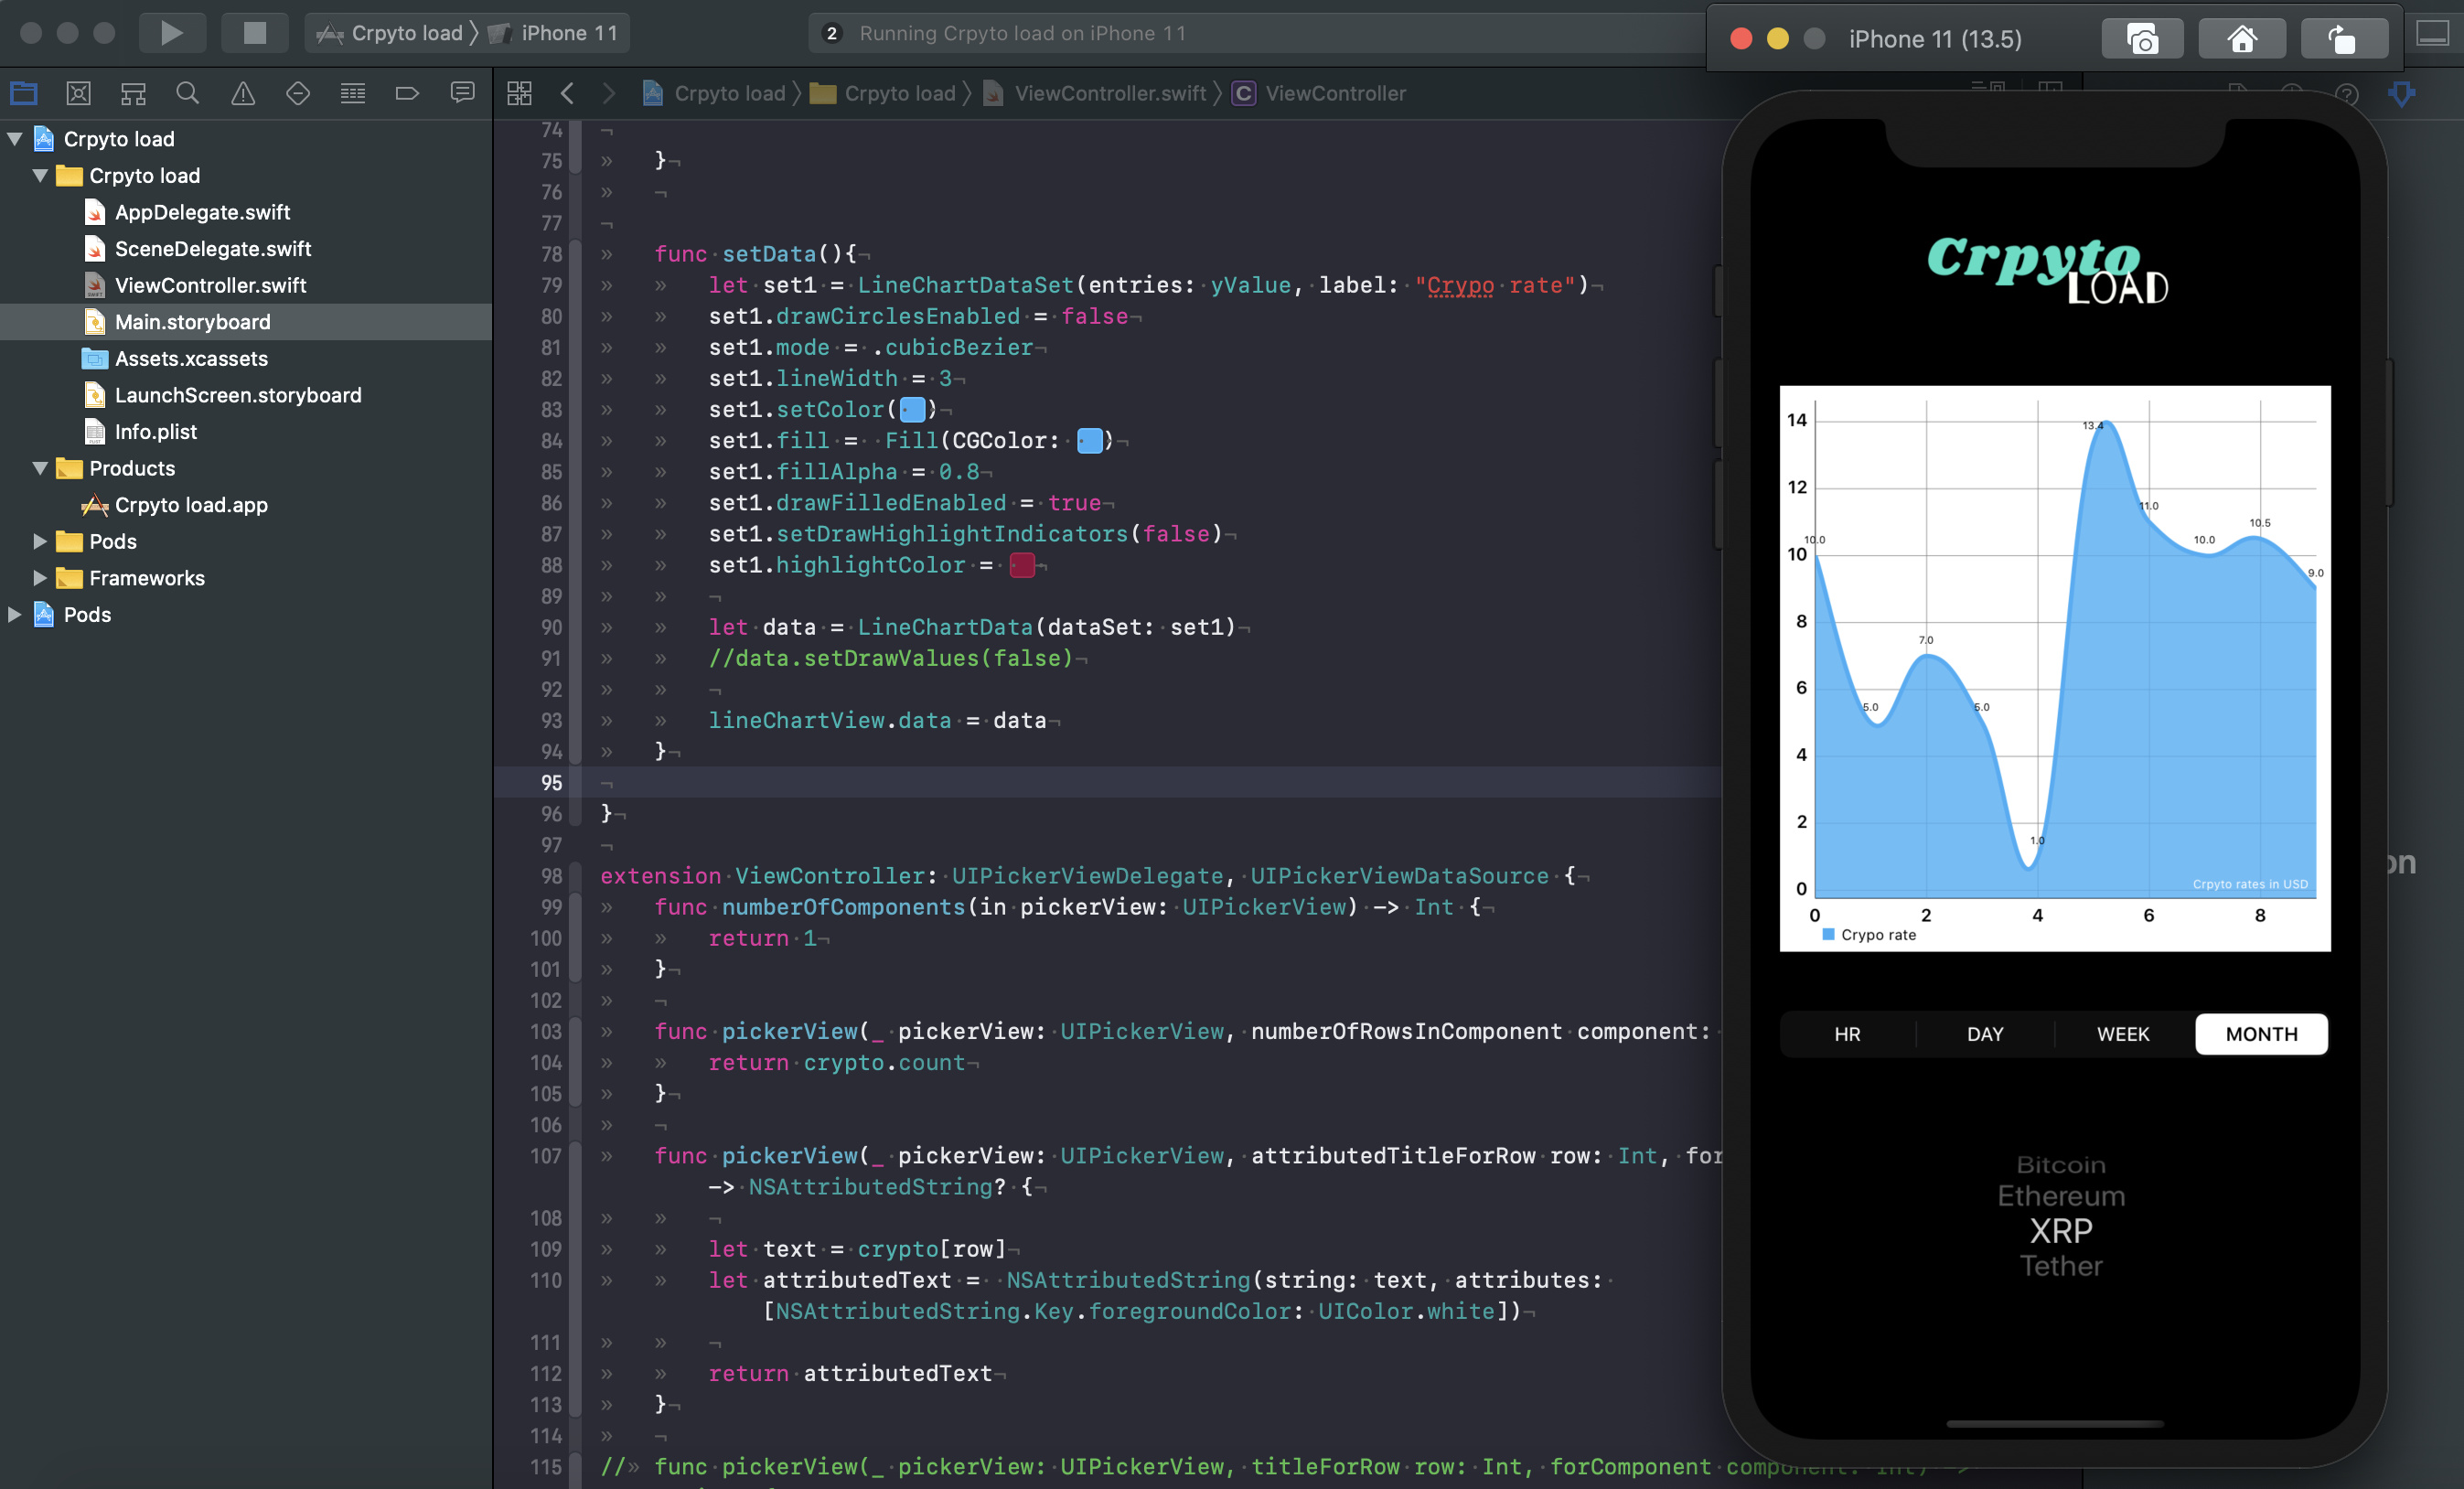
So I managed to finish the design of the line chart, working with carts is pretty cool.
The chart frame made everything a lot easy and fun.
here is how it looks:
So next I will work on getting and structuring out my data from the API
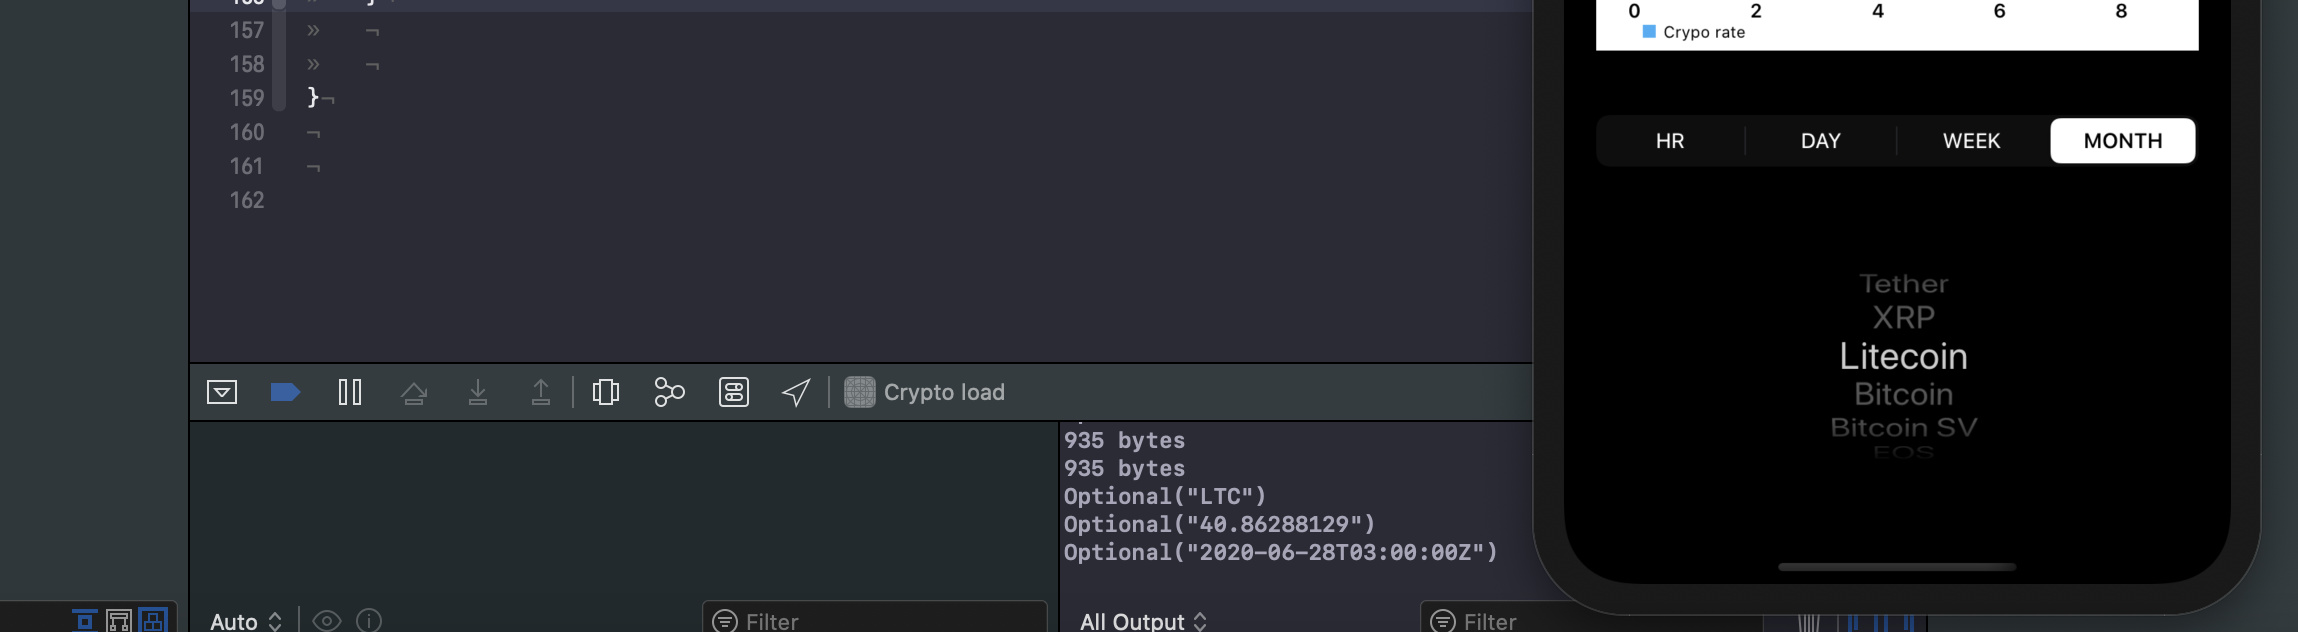
So no UI change in this update but I manage to get the data from the API and parse out the JSON into objects.
My next task to represent the data using the line chart
Hey guys,
Well I may have started the challenge late but I am glad I was able to complete the project in time. Even though the app is really simple, I actually learnt a lot, especial on sending and receiving network request and parsing JSON and I had a lot of fun testing out the Chart package, something I will definitely be using again.
You can view the sample view below: